0

NOVA: Cyberwarfare Abstraction

Cyberwar Threat In the early ages of the internet, not much was known regarding cybersecurity as much as it was a threat back then. While the previous documentary touched upon the dangers of hacking and the usefulness of cryptography, this next documentary, entitled CyberWar Threat, deals with the dangers of cybersecurity at a national and global scale. 

We're living in an era, now, where we have to wonder whether people can cause damage with computer code that, before, they could only cause with a bomb.
– Shane Harris, Author of @War

Thanks to leaked documents courtesy of whistleblower Edward Snowden, we are able to uncover the details behind the National Security Agency (NSA) and much of their offensive tactics in cybersecurity protection. The NSA was otherwise known as the "hacking agency" responsible for the creation of the Stuxnet, but is now changing to the development of weapons. President Truman in 1952 proposed that the NSA should be all ears in eavesdropping on international phones and radios. The NSA's role transformed from a passive listener to an active spy when Gen. Michael Hayden became the the agency's director. It was also at this time that Pres. Bush ordered the NSA to prepare for a "full on war" after 9/11. 

This brought upon the creation of the Cyber Command, known as the first cyber weapon, where hackers can control, screenshot, and turn out one's webcam at will, and use Zero-Day Codes–codes used against user vulnerability unbeknownst to a company or target. Stuxnet used five of the privacy-breaching codes to hack a private company is Hamburg, Germany to search for a certain product's model number. 

While the destruction of Iranian centrifuges may have delayed Iran’s bomb program and forestalled an Israeli attack, the attack has opened a Pandora's Box, and now America's own critical infrastructure is vulnerable to retaliation and attack. With leading defense experts and investigative journalists who have probed the murky realm of criminal and strategic hacking, NOVA examines the chilling new reality of cyberwar in which no nation or individual is safe from attack.

Photo from NOVA PBS Official

0

NOVA: Rise of Hackers Abstraction

In the early ages of the internet, not much was known regarding cybersecurity as much as it was a threat back then. In this documentary, Rise of the Hackers, covers the process of cybersecurity specialists Liam O'Murchu (Symantec) and Eric Chien and their experience regarding specific cybersecurity dilemmas that require utilising cryptography.


"The greatest threat today, to the world, is the keyboard"
– Sean McGurk, Rise of the Hackers

Photo from zdnet.com
The documentary begins with the retelling of the events regarding the hacking against Mat Honan (WIRED Magazine). Honan recalls that the attack began on his laptop, and then soon spread to the rest of his devices in an attempt to get a hold of his personal data. Amidst the threat, the hackers were able to contact him via his Twitter account and admitted they were a bunch of teenagers. It was during this exchange that Honan proposed a deal to the youths that if they were to confess their process of hacking, he would not press charges.

The youths complied and said that they were able to hack Hanon via the last three numbers of his credit card. By accessing these, they were able to deduce his Amazon account (which is connected to his credit card), then proceeds to his Apple devices, then within that his Google accounts (such as emails), and then eventually his Twitter account. 

The second story covered by the documentary is regarding the malware Stuxnet. As analysts for the giant cybersecurity firm Symantec, Eric and Liam investigate the viruses that pop up on computers around the world. Most malicious software, or malware, they see is pretty run of the mill. But in July, 2010, they started analyzing a baffling and crafty piece of code that another security company had just posted online: a virus nicknamed Stuxnet.


"This was truly a digital Pandora's Box. Once it was opened, you could not put the lid back on."
– Sean McGurk, regarding Stuxnet in Rise of the Hackers


Left to right: Liam O'Murchu and Eric Chien. Credit to Paul Cooke/@BBC

0

Cybersecurity: Summary

Viruses and Malware -- a computer security vulnerability wherein one computer could send another instructions to delete everything on it or take it over, or impersonate another's identity by guessing, cracking, or extracting a password.  
These vulnerabilities will never be rid of, because they are built in the internet's very architecture.

Photo from checkpoint.com


Public-Key Cryptography

  • Begins with a publicly available number
  • Addition of secret numbers, Private number A, to be mixed using;
  • Modular Math, or mathematical operations, with a another number;
  • Private Number B, to create a secret key.

For example, one's email service will use this secret key to transform and scramble your message. It will then transmit your coded message to your recipient, wich will also use this secret key to reverse the transformations and reveal the message you've sent.


Hacking -- "creative" problem-solving that takes advantage of the property of things in unexpected ways. 

Computer Hacking -- "creative" problem-solving that takes advantage of the property of computers and networks in unexpected ways. 

When one hears the word "hacker," it initially gives off a negative connotation, but the role of a hacker is flexible; Hackers can be a range of people, from criminals for theft, government for surveillance workers, to hacktivists for political agendas. Whether they're good or bad depends on why they hack in the first place. 
0

Encryption: Essential Questions

1. How is encryption accomplished to safeguard data exchange?

Photo from cdn.pixel.privacy.com
According to us.norton.com, Encryption is the process of converting ordinary text, such as a typed email or message, into an unreadable format called “cipher text.” This helps protect the confidentiality of digital data either stored on computer systems or transmitted through a network like the internet.

When the intended recipient accesses the message, the information is translated back in the form of decryption.

To unlock the message, both the sender and the recipient have to use a “secret” encryption key — a collection of algorithms that scramble and unscramble data back to a readable format.


2. What methods are used to compress data?

There two methods used to compress data, lossy and lossless compression.


3. What is lossy and lossless data compression?

According to ukessays.com, Lossless data compression makes use of data compression algorithms that allows the exact original data to be reconstructed from the compressed data. This can be contrasted to lossy data compression, which does not allow the exact original data to be reconstructed from the compressed data.


4. What ethical dilemmas are created from access to data?

When one is give access to data, this means we have a plethora of information such as charts, recipes, art, records, music, etc. at our disposal. One major ethical dilemma that may arise from this is the means one of accessing data (and disclosed data), and the manner and usage of such.
Mary Ann Baily from nap.edu outlined positions at both extremes of the policy debate over data access, then made the case for pursuing a middle ground—striking a balance between the right to be left alone and the obligation to cooperate in the pursuit of communal goals.

0

Big Data

Here's some back-to-back content, as this post is related to my previous big data one. Here's some more thoughts on Big Data:

How is Big Data related to Computer Science?

 According to www.educba.com, big data falls under data science, which is a subset of computer science. In addition, the interpretation and analysis of big data is closely dependent on the mechanics of computer science, as we definitely need to rely on machines to do nitty-gritty tasks like organization and presentation, while humans will find the conclusions and act upon the results of the big data.
Photo from milo.medium.com


What makes data "big?"

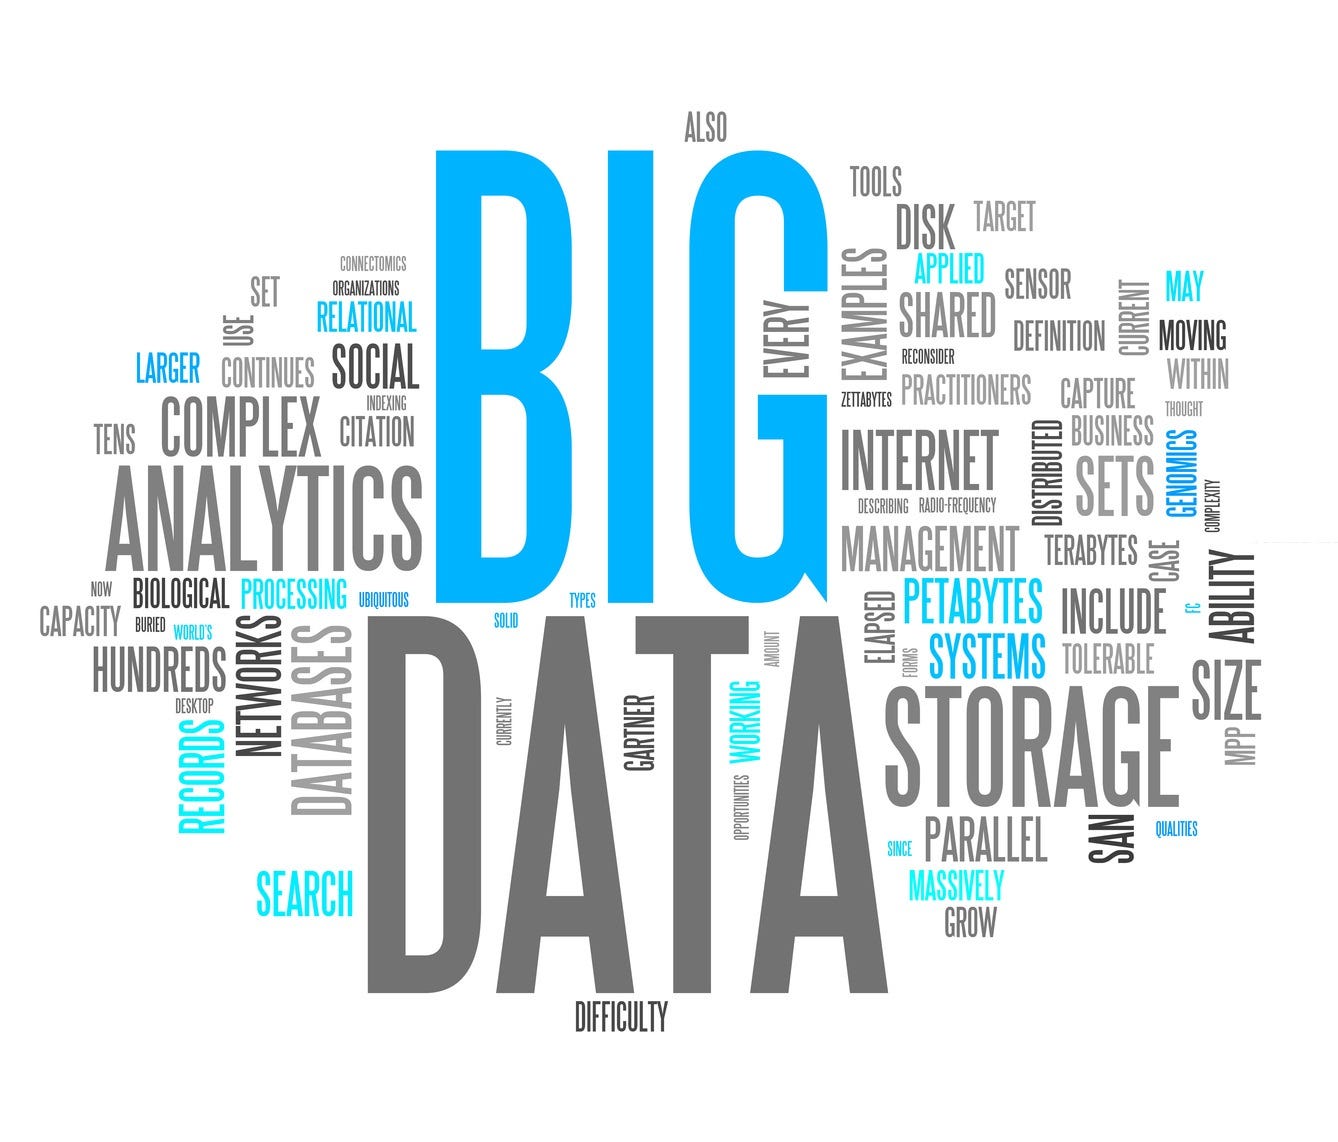
What makes big data "big data" is the fact that it the information of a certain subject is capable of producing mass amounts of data and metadata at an instantaneous rate to the point that its organisation, interpretation and analysis cannot keep up with the continuous influx of information.


What are three things you learned about Big Data from the videos?

1. I've learned that Big Data's definition is far more deeper than the self-explanatory nature of its name.

2. Big Data is most notably known for it's assistance in determining what's trending in nearly all social media sites and platforms, from YouTube, Twitter, Tumblr, etc.

3. The effects of big data, if furthered, can greatly alter our lifestyle. As more big data is interpreted and used to cater to a demand, the various aspects of life such as entertainment, education, etc. will greatly improve and come to affect a wider audience.

Photo from cdn.datafloq.com

0

Intro to Big Data & the Joy of Stats

Hello! I've heard that this 'big data' will be an important term later in the year, but to think that 'later' would come to be now. times flies. Here are three videos showcasing application Big Data to get a better wrap around the concept. 

1st Video: What is Big Data and How Does it Work?

The video dives straight into application of big data itself rather an than providing a direct, textbook definition. It can be inferred from the examples within the video that big data is the processing of massive myriads of data to used in further catering to the interests of those affected by the information such as users, clients, gamer, etc.


2nd Video: What is Big Data?

This 2-minute video of the same title begins with the statement: As technology advances, items that will collect and transmit data will increase as well, bringing the need for the interpretation and analysis of such. The video then explains that the influx of this miscellaneous information called big data and the how it can be made sense of and serve as relevant to us. The narrator then hints the potential endless purposes big data may come to provide.


3rd Video: The Joy of Stats

The video begins with a personal commentary of Han Rosling himself introducing his large statistic project demonstrating the quality of life of 200 countries through the categories of life expectancy and average wage. While this does not explicitly state anything regarding big data, The video is great example of big data and its capabilities because Rosling managed to analyze a huge mass of data and interest then present it in a meaningful and beneficial manner.


0

Post X: Computing and Data

Hi! Seeing concentrations and clusters of data make me dizzy, especially when they're formatted in spreadsheets. I wish analyzing information could be as easy as reading from a picture book. 

But besides causing me nausea, there are definitely a lot of benefits to having data processes and analysis. here are some questions that answer that.

How can computing help process data and information to allow gaining insight?


  • Computers have the ability to perform tasks and organize data in larger quantities and shorter times with little to no error. It goes without saying that such power and speed easily surpasses that of humans. When these time-consuming and arduous processes are covered, people can now focus on the bigger picture and see their data as a whole, creating new insights that enable us to further enhance the quality of information processing and help point out mistakes ever noticed before.

What considerations should be employed in manipulating data?

  • According to ori.hhs.org, Whether statistical or non-statistical methods of analyzes are used, one should be aware of the potential for compromising data integrity. While statistical analysis is typically performed on quantitative data, there are numerous analytic procedures specifically designed for qualitative material including content, thematic, and ethnographic analysis. Regardless of whether one studies quantitative or qualitative phenomena, researchers use a variety of tools to analyze data in order to test hypotheses, discern patterns of behavior, and ultimately answer research questions. Failure to understand or acknowledge data analysis issues presented can compromise data integrity.

How can large datasets allow for finding patterns in order to problem solve and make predictions?

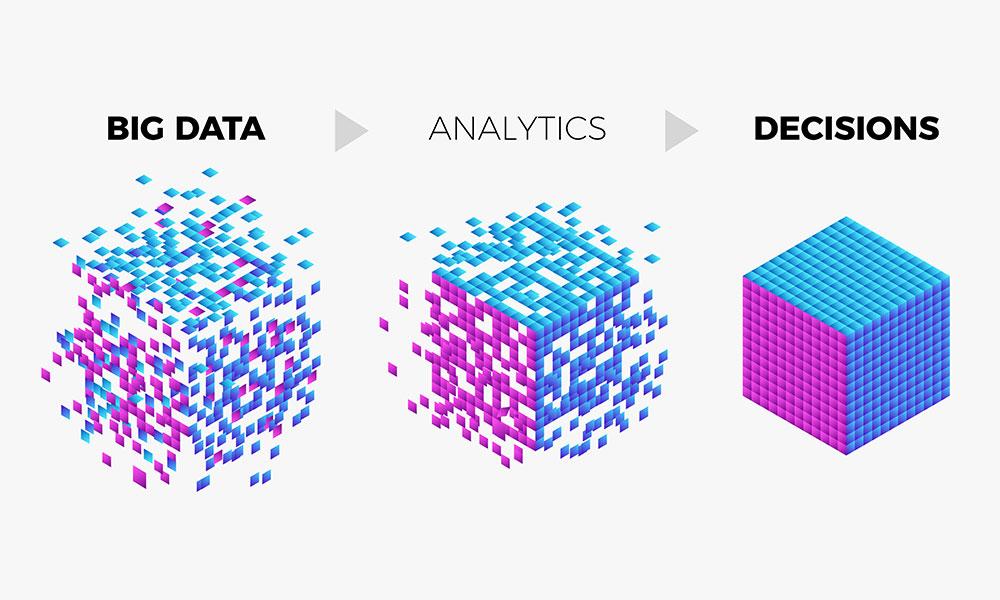
  • Big data analytics examines large amounts of data to uncover hidden patterns, correlations and other insights. With today’s technology, it’s possible to analyze your data and get answers from it almost immediately – an effort that’s slower and less efficient with more traditional business intelligence solutions.
Photo from sas.com


0

Post IX: GUI and Program Design

Hi again! To be honest, I've only felt minuscule inklings towards programming and all things computer science, thinking my maximum computer interaction would be limited to Adobe and Clip Studio Paint (my digital art program), as I have a huge affinity for the arts. Although upon taking Computer Science Principles, I now can't help but want to incorporate what I've learned into what I love, and what resulted from that is this interest in Graphic User Interface (GUI) and Web Design, as I see the topic as a reasonable application for both.

Below are some questions regarding these two and a bit more.

1. What elements must be considered in designing a user interface?

According to Oluwatobi Akindunjoye of UX Colllective, the fundamental elements of interface design are:


  • Language - Words are important when working with titles or the name of a brand. The phrasing and tone of your words can be used to set and direct the intents and atmosphere of your website, which may be serious, playful, etc.
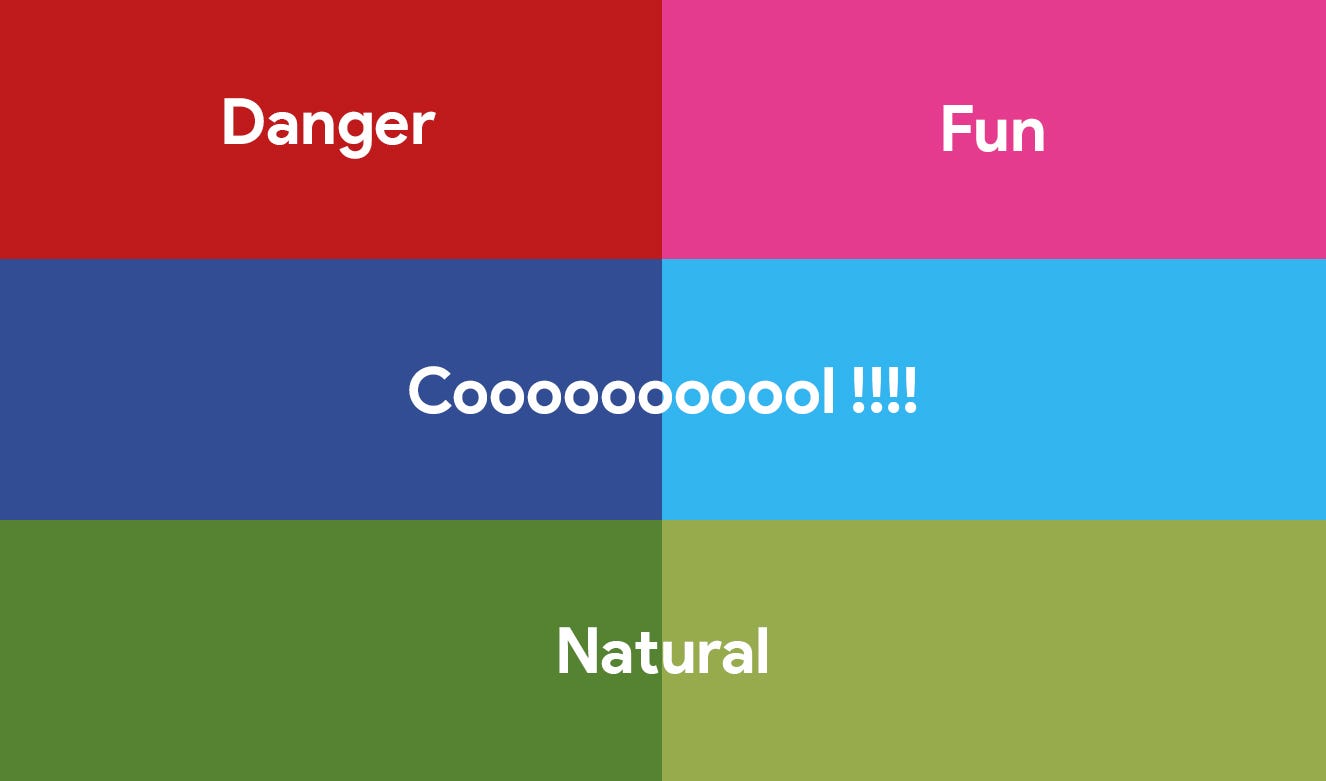
  • Color - They are used to either set the mood of one's website or help your website's navigation.
Photo from miro.medium.com
  • Imagery - Can come in different styles such as shapes, illustrations, photography, 3D renderings, etc. But whatever the style, they can serve as content, mood, and navigation.
  • Typography - This can serve as the content on which we consume or can serve as a part of once's interface. Certain fonts and styles can determine the readability and professionalism of one's website.
  • Icon - Icons are a special kind of imagery that allow one to explain one's own services with a hint of personal visual style. They also bring recognizability that enable others to differentiate you from other designs.

2. What abstractions and layers of abstraction are in programs?

  • According to Sweetwater.com, in computing, an abstraction layer, or abstraction level, is a way to hide the implementation details of deep functionality, allowing the separation to facilitate interoperability and platform independence. This is how peripherals can work with computers using different operating systems. For example, an audio interface can connect to the USB port of a computer running either macOS or Windows; the interface doesn’t need to be re-coded to work with each operating system, instead the interface only needs to have a driver that can run on each operating system’s abstraction layer.


Photo from milo.medium.com

3. How are well developed algorithms a component of programming and program design?

  • An algorithm is defined as a process of specific steps in order to accomplish a task. They are the instructions integrated into a program and then given to a computer. The more specific, clear, and thorough one's instructions, the less often one will encounter problems in their program. 

0

Flowchart: Essential Questions

As a visual and spatial learner, the linear format of coding in nearly every programming language can be an occasional eyesore. Which is why aside from planning out a program, I find flowcharts just the thing to keep me from crossing my eyes when coding.

To further emphasise the concept of flowcharts, here are some essential questions to fill your head:


1. Why are flowcharts useful to illustrate programs?

  • As stated in inc.com, flowcharts are an important tool for the improvement of processes. By providing a graphical representation, they help project teams to identify the different elements of a process and understand the interrelationships among the various steps. Flowcharts can be used to document not only programs for coding, but also virtually any type of business system, from the movement of materials through machinery in a manufacturing operation to the flow of applicant information through the hiring process in a human resources department.


2. What are reasons programmers use flowcharts?

  • According to Sampson Quain's article on the topic, flowcharts are used to define a work process, evaluate the timing of tasks, and troubleshoot and fix problems. One of the most important uses of flowcharts are to depict through images how a process is performed from start to finish, typically in sequential order. A process flow diagram is often used in training to document an existing process or to evaluate the efficiency of that process. Another important purpose of flowcharts are to identify how long it takes to complete each task in a specific process. This is especially useful when you are analyzing deadline-oriented tasks and processes because flowcharts show you areas in which tasks require more efficiency and areas in which the completion of one task is dependent on the completion of another task. That’s why troubleshooting is also another vital purpose of flowchart. It’s difficult to fix bugs and problems in workflow, especially if you don’t know what went wrong and at which stage in the process it went wrong.


3. What are the elements of a flowchart?

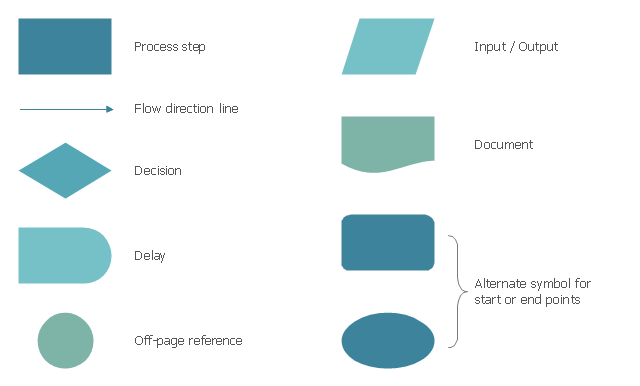
According to geeksforgeeks.org, the basic element of a flowchart are as 
follows:

  • Terminal – An oval symbol that indicates start, stop, and halt in a program's logic flow. Terminals are the first and last symbols in a flowchart.
  • Input/Output – A parallelogram that denotes any function of input/output type.
  • Processing – A box represents arithmetic instructions. All arithmetic processes such as adding, subtracting, multiplication and division are indicated by action or process symbol.
  • Decision – Diamond symbol represents a decision point. Decision based operations such as yes/no question or true/false are indicated by a diamond in a flowchart.
  • Connectors – Whenever flowchart becomes complex or it spreads over more than one page, it is useful to use connectors to avoid any confusions. It is represented by a circle.
  • Flow Lines – Flow lines indicate the exact sequence in which instructions are executed. Arrows represent the direction of flow of control and relationship among different symbols of flowchart.


Photo from conceptdraw.com

4. How does Sequencing affect a programming project or plan?

  • Sequencing allows the flow of a project or plan to go smoothly. Applying proper sequencing before the execution of a project allows one to ascertain at least a brief overview of the possible work load, work flow, and begin to appropriately allocating work accordingly. This also gives one the upper hand for time management and checks on the feasibility of your project.


5. How do computers receive instructions?

  • According to computer hope.com, a computer is given instructions by a human using a keyboard or another input device. To interpret these instructions, the computer uses an operating system, or software that is also programmed by a human to translate the user commands into something the computer can understand.

0

Unit III: Essential Questions

Back-to-back content! I'm here following up with the next unit's essential questions. With the end of the quarter been early October, we have gone through about two more units.

1. What is block-based programming?

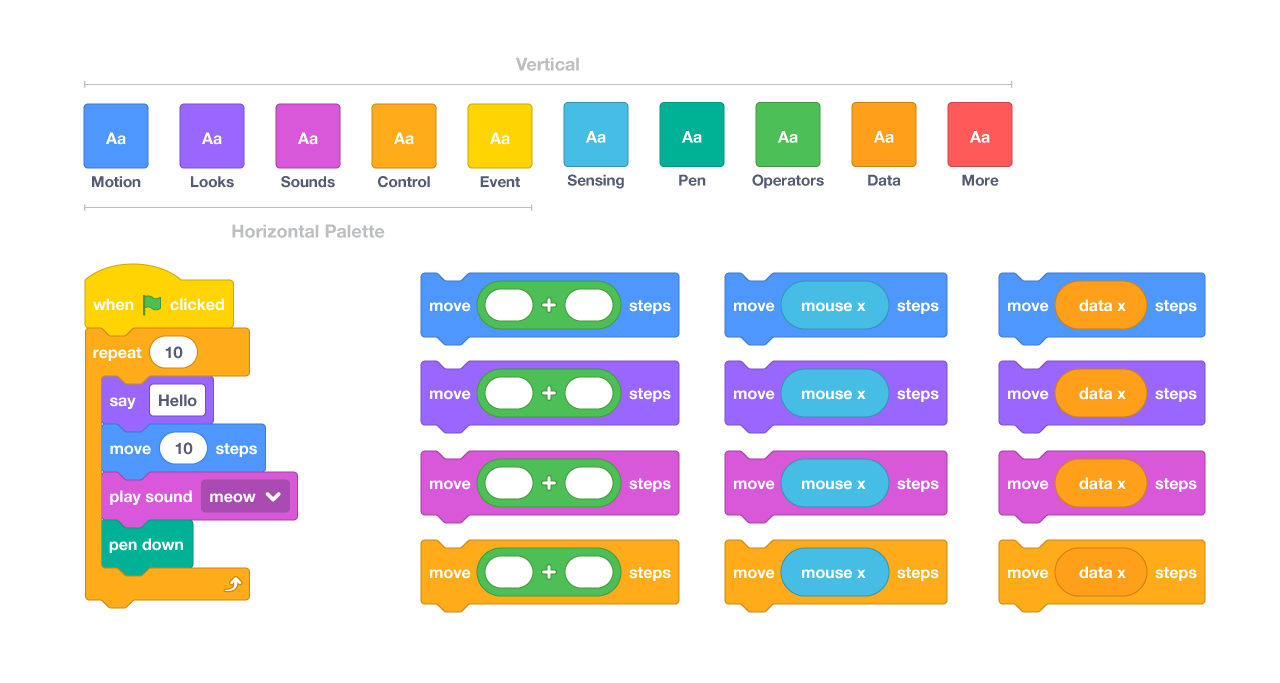
  • According to the Scratch Wiki, block-based coding, sometimes known as block based-programming, is coding within a programming language where instructions are mainly represented as blocks. One example of a block-based programming language would be Scratch.

Image from scratch.mit.edu 

2. How do abstractions and layers of abstractions enable smooth user interface creation in a game?

  • Integrating abstraction and abstraction layers can allow player to move around the camera (zoom in and out) of a game, and able to let them feel more smooth during gaming, specially in 3 dimension games.  Also abstractions can allow programmer to separate layers of abstraction to deal with.


3. What components make an effective game?

  • According to Grace Li from Game Skinny, components such as a solid story, attractive visuals, intuitive controls, worthwhile long-term goals, a good soundtrack, replayability, interesting and engaging game mechanics, all the shill possessing originality and consistency.

0

Unit II: Essential Questions

Another month another unit, here we go!


1. How are flowcharts and pseudo code useful in program design and planning?

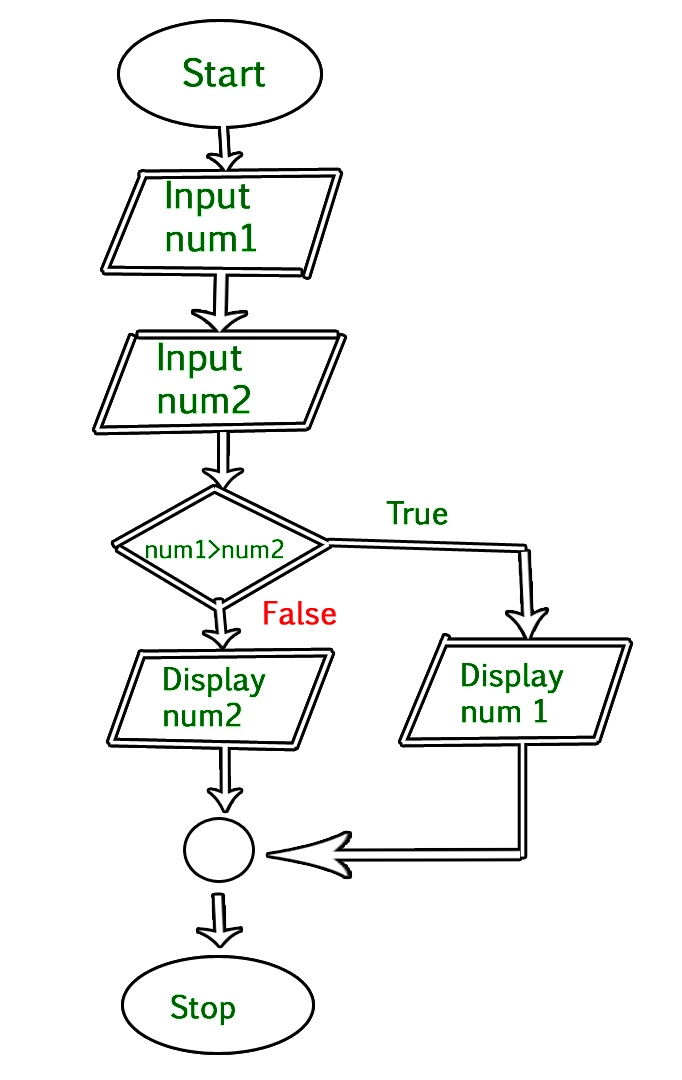
  • They are useful because they serve as a fundamental step in the conceptualization of any program. By writing or drawing your code before encryption, it gives one a bigger picture of the scale of the project and any possible obstacles such as bugs. An example of a flowchart can be seen on the right.


2. How are layers of abstraction represented and developed in programs?

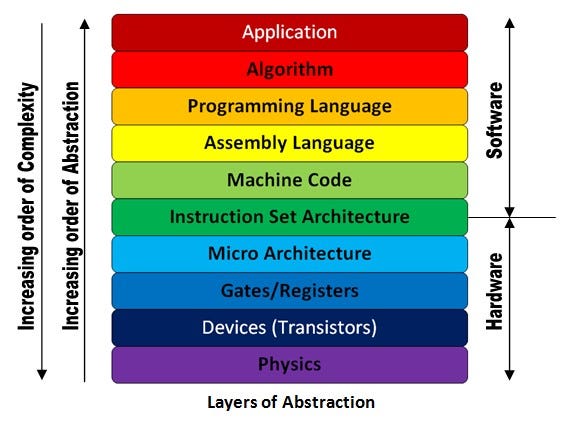
  • According to Luciano Floridi and J.W. Sanders of Oxford University and University of Bari, computer science commonly presents levels (or, less commonly, layers) of abstraction, wherein each level represents a different model of the same information and processes, but with varying amounts of detail. 
  • Each level uses a system of expression involving a unique set of objects and compositions that apply only to a particular domain. Each relatively abstract, "higher" level builds on a relatively concrete, "lower" level, which tends to provide an increasingly "granular" representation. For example, gates build on electronic circuits, binary on gates, machine language on binary, programming language on machine language, applications and operating systems on programming languages. Each level is embodied, but not determined, by the level beneath it, making it a language of description that is somewhat self-contained.


3. What is a computational artifact?

  • According to the University of Rhode Island, a computational artifact is anything created by a human using a computer. An artifact can be, but is not limited to, a program, image, audio, video, presentation, or web page file.


4. How are programs created to solve problems?

  • Programs can be created to perform the following steps in order to solve certain problems: information representation, an algorithm, encapsulation, abstraction/complexity hiding, or even brute forcing. 
Image from webbiquity.com 

0

My Rubik's Cube Algorithm

Hello! To demonstrate our understanding for algorithms, my APCSP teacher had each of my classmates and I solve a Rubik's cube then write our solving process down. She first instructed us to solve any one side, then continue to work on the entire cube. It was my first time striving to complete one, but I gave it my all. Here's my go at it!

This is the initial, jumbled up cube:


One Side: White


Step 1: Turn the blue face clockwise once.


Step 2: Turn the middle row clockwise once.


Step 3: Turn the orange face counterclockwise once.


Step 4: Turn the blue face counterclockwise once.


Step 5: Turn the leftmost column downward/to the left once.


Step 6: Turn the middle row clockwise once.


Step 7: Turn the leftmost column downward/to the left once.


Step 8: Turn the rightmost column upward/to the left twice.


Step 9: Turn the leftmost column upward/to the right once.


Step 10: Turn the bottom row counterclockwise once.


Step 11: Turn the leftmost column downward/to the left once.


Step 12: Turn the right most column upward/to the left once.


Step 13: Turn the bottom row clockwise once.


Step 14: Turn the rightmost column upward/to the left once.


Step 15: Turn the bottom row clockwise once.


Step 16: Turn the rightmost column downward/to the right once.


Step 17: Turn the bottom row clockwise twice.


Step 18: Turn the rightmost column upwards/to the left once.


Step 19: Turn the bottom row counterclockwise once.


Step 20: Turn the rightmost column downward/to the right once.


Step 21: Turn the bottom row clockwise once.


Step 22: Turn the rightmost column upward/to the left once.


Step 23: Turn the bottom row counterclockwise twice.


Step 24: Turn the leftmost column upward/to the right once.


Step 25: Turn the bottom row clockwise once.


Step 26: Turn the leftmost column downward/to the left once.


Step 27: Turn the bottom row counterclockwise once.


Step 28: Turn the leftmost column downward/to the left once.


Step 29: Turn the bottom row counterclockwise twice.


Step 30: Turn the leftmost column upward/to the right once.


Step 31: Turn the bottom row clockwise once.


Step 32: Turn the leftmost column downward/to the left once.


Step 33: Turn the bottom row counterclockwise once, then turn the leftmost column upwards/right once.


Yay! One side completed!


Now for the rest of the cube:


Step 1: In order to solve the entire cube, I needed to solve all the entire middle row first.


Step 2: Fix the red and blue side first.


Step 3: Turn to the other side of the cube then solve for the colors green and orange.


Step 4: Flip the cube then begin solving for the yellow side. Start by making a plus sign from the yellow then solving for its corners.


Step 5: Once the yellow side has been solved, turn the top row to align the corner colors with their respective side.


Step 6: Solve to align the orange side.


Step 7: Once the orange side has been completed, solve for the rest of the sides the same way.

All Done!